Analytics
TIP
ShortsWorks has built-in analytics: per-short views, watch time, product-tag clicks, click rate, total and average watch time. Use it to learn what's working. It's the Dashboard tab in the app.
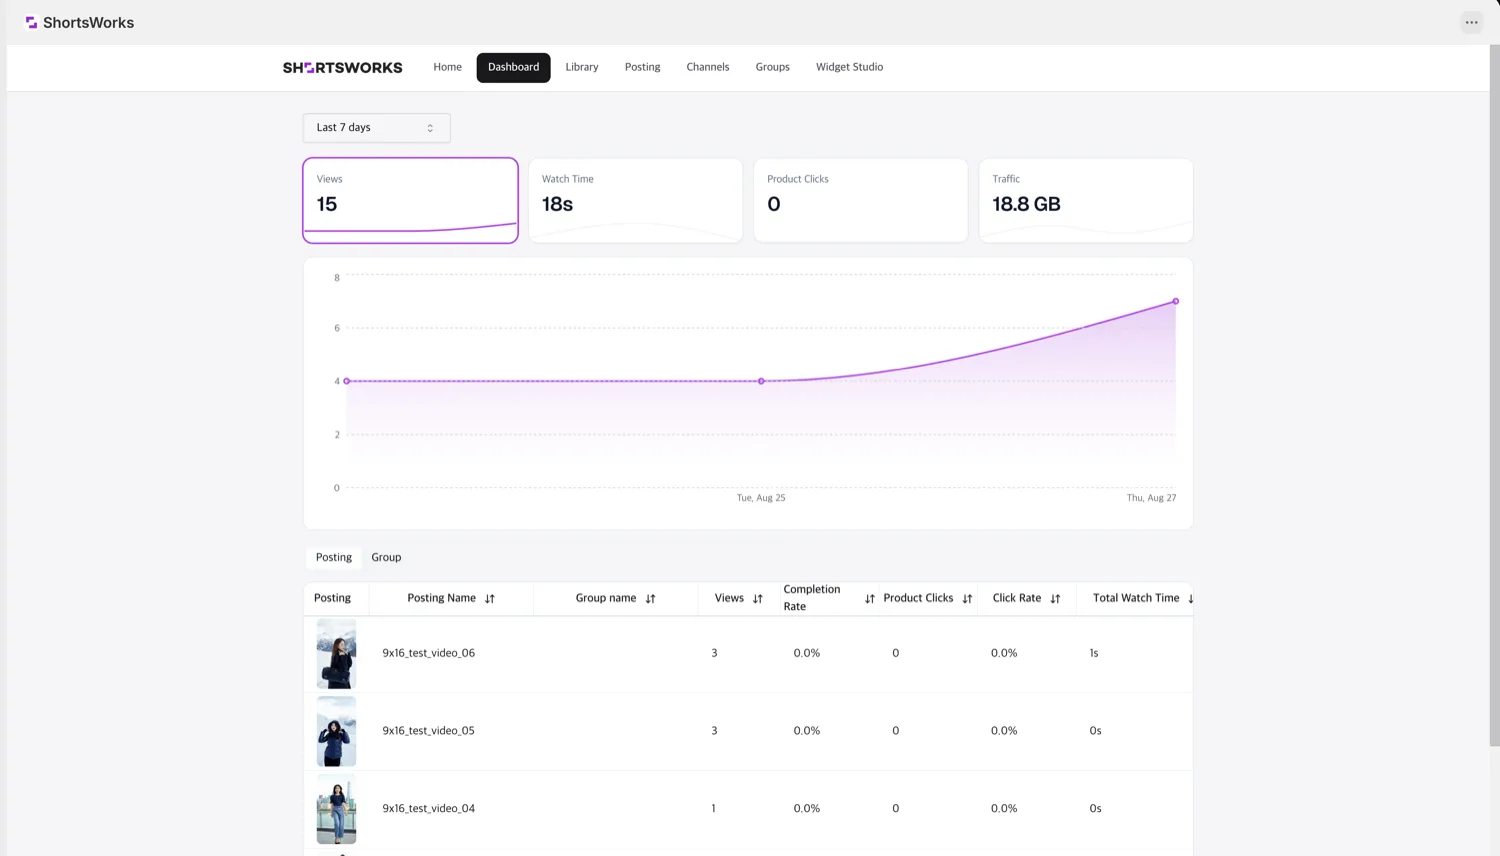
Pick a date range at the top to see stats for that period.
Summary & trend
- Views — total views across all shorts in the range.
- Watch time — total watch time in the range.
- Product clicks — total product-tag clicks/taps in the range.
- Traffic — total delivery traffic from your shorts (summary only for now; per-short traffic is coming).
- Chart — the trend over the range; tap a day to see its data.
Per-short table
- Thumbnail / Short name — the short's thumbnail and the title you gave it.
- Group — the groups the short belongs to. Grouping lets you slice the data, so it's worth setting up (Groups).
- Views — counted when someone opens a short and starts watching.
- Completion rate — how much of the video was watched start to finish. Watching 30s of a 1-minute video is 50%.
- Product clicks — taps on the product tag that jump to the product page.
- Click rate — clicks relative to views. A high rate means the content drives shoppers to buy.
- Total / Average watch time — per short.
Per-group
Switch to the Group tab to see stats by widget group. Selecting a group filters the summary and table to that group's content.